Inflation in the Republic of Kazakhstan
For the month (October 2022 year)-inflation was 1.6%.
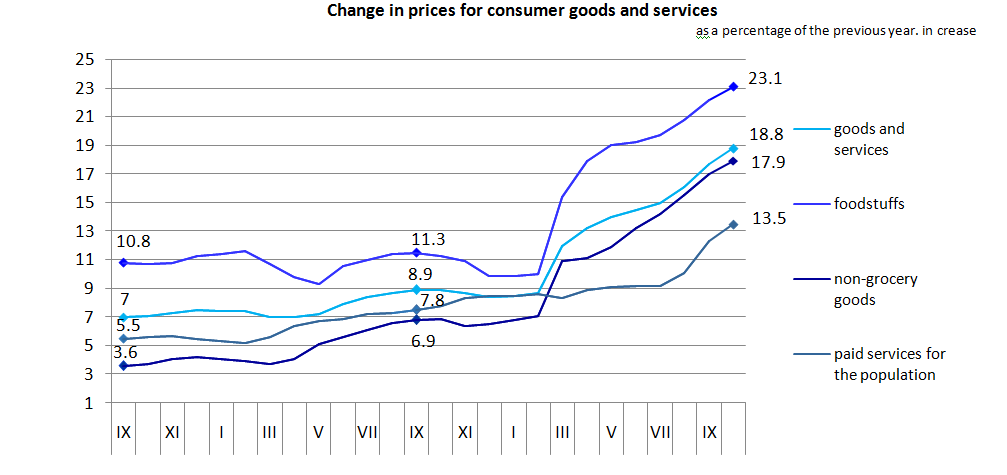
Change in prices for consumer goods and services
percent, in crease
|
|
October 2022 |
For reference: September 2022 |
|||
|
October |
December |
September |
September |
August |
|
|
Goods and services |
18,8 |
17,2 |
1,6 |
17,7 |
1,8 |
|
Foodstuffs |
23,1 |
21,2 |
1,4 |
22,2 |
1,2 |
|
Non-grocery goods |
17,9 |
16,0 |
1,7 |
17,0 |
1,9 |
|
Paid services for the population |
13,5 |
12,6 |
1,7 |
12,3 |
2,7 |
Non-food products in October compared to September 2022 rose by 1.7%. Prices for detergents and cleaning products increased by 5%, clothing and footwear, personal goods, household goods – by 2.1%, tableware – by 1.9%, textiles – by 1.7%. Coal rose in price by 2.1%, firewood – by 1.7%.
The price level for paid services has increased by 1.7% over the past month. The increase in prices was noted for hotel services by 6%, the organization of complex recreation – by 4%, services in the field of recreation and sports events – by 3.3%, baths – by 3%, children's development centers – by 2.9%, catering – by 2.2%.
Food prices increased by 1.4% in October 2022. Tomatoes rose in price by 21%, cucumbers – by 14.7%, eggs – by 6.3%, fish and seafood – by 2.3%, bakery and flour products – by 2.2%, soft drinks – by 1.9%, cheese and cottage cheese – by 1.8%. Carrots fell by 5.6%, beets – by 5.5%, onions – by 5.1%, potatoes – by 3.5%, cabbage – by 2.6%, granulated sugar – by 2.3%.
Inflation in October 2022 was 18.8% year-on-year. Prices for food products increased by 23.1%, non–food products - by 17.9%, paid services – by 13.5%.
"The Bureau calculates the consumer price index indicator monthly. which characterizes the level of inflation. We are observing changes in tariffs and prices for services and goods for a total of 508 items. Prices are registered through a selective network of trade and service enterprises of various forms of ownership in all regional centers, the capital and a certain circle of cities and district centers." – explains Kuanyshbek Zhakypbekuly, Director of the Bureau's Price Statistics Department.
*Since January 2022, when constructing the consumer price index, the share of food products is 40.7%, non–food products – 30.2%, paid services – 29.1%.